By Jinee
How To'sIf you're a beginner, it's essential to understand the fundamental concepts of map drawing. Maps are visual representations depicting geographic features, topography, and other information. A well-designed map effectively communicates information to viewers. To create accurate and informative maps, you must consider several critical elements, such as scale, symbols, and orientation.
Scale refers to the ratio between the distance on a map and the corresponding distance on the ground. It allows viewers to understand and interpret the distances and sizes of features on the map. Symbols represent geographic features, such as rivers, roads, or buildings, and have specific meanings that viewers can understand. Orientation refers to the direction of the map in relation to geographic features, which can be determined using cardinal directions, such as North, South, East, and West.
When creating a map, it's crucial to consider these fundamental elements and ensure that they accurately represent the geography and topography you're depicting. Understanding these basics is the first step in creating an informative and visually appealing map that readers can understand.
Before you start drawing your map, it's crucial to gather accurate and relevant data to ensure its accuracy. Data collection can be done through various methods, such as field surveys, satellite imagery, and existing maps. However, it's crucial to ensure that the data you collect is reliable and relevant to the purpose of your map.
One way to ensure that the data you collect is accurate is to use multiple sources. This means cross-checking information from different sources to avoid any errors or inconsistencies. It's also important to make sure that the data you collect is relevant to the area you're mapping and up-to-date.
Field surveys involve collecting data on-site. This method is often used to gather accurate information on features such as terrain, land use, and infrastructure. It's essential to have the necessary equipment, such as GPS and cameras, and to collect data systematically.
Satellite imagery is an excellent tool for data collection and is particularly useful for large-scale mapping projects. This method involves using satellite images to collect data on features such as land cover, topography, and vegetation. Satellite imagery can be obtained from various sources, including Google Earth and other remote sensing agencies.
Existing maps can be used as a source of data when creating a new map. This method involves using previously created maps, such as topographic maps or thematic maps, to gather information. However, it's important to ensure that the information on the existing map is still accurate and relevant, and that any data you use is appropriately attributed.
Remember that the accuracy and relevance of your map depend heavily on the quality of data you collect. So, take your time, verify your sources, and ensure that your data is accurate and relevant before diving into the map drawing process.
Map projections are essential in creating accurate and readable maps. However, choosing the right one can be challenging with the variety of options available. To assist you, we will explore the different types of map projections and how to select the most appropriate one for your map.
A map projection is a technique of representing the curved surface of the Earth on a flat map. There are numerous map projections available, each with its advantages and limitations. The ideal projection depends on the purpose of your map and the area you intend to represent.
The Mercator projection is one of the most commonly used map projections. It is known for its ability to preserve lines of constant direction or rhumb lines. However, it significantly distorts the size of landmasses towards the poles.
The Peters projection is renowned for its ability to accurately depict the relative size of landmasses. It is particularly useful when portraying developing countries. However, this projection distorts shapes towards the poles.
The Robinson projection is a compromise projection that aims to balance the distortions that occur in other projections. It is commonly used for general-purpose maps as it produces pleasing shapes and proportions across the entire map.
When selecting a map projection, consider the purpose of the map, the area you intend to represent, and the intended audience. For instance, if your map is for navigation, the Mercator projection may be the best option. On the other hand, if you're creating a world map to show landmasses' relative sizes, the Peters projection is a better choice.
It is essential to research and analyze different projections to find the most suitable one for your map. There are various resources online that provide interactive maps to compare different projections. Consider experimenting with different projections to determine their strengths and limitations.
Now that you have gathered all the necessary data, it's time to start drawing your map! Follow these step-by-step instructions to create an accurate and visually pleasing map.
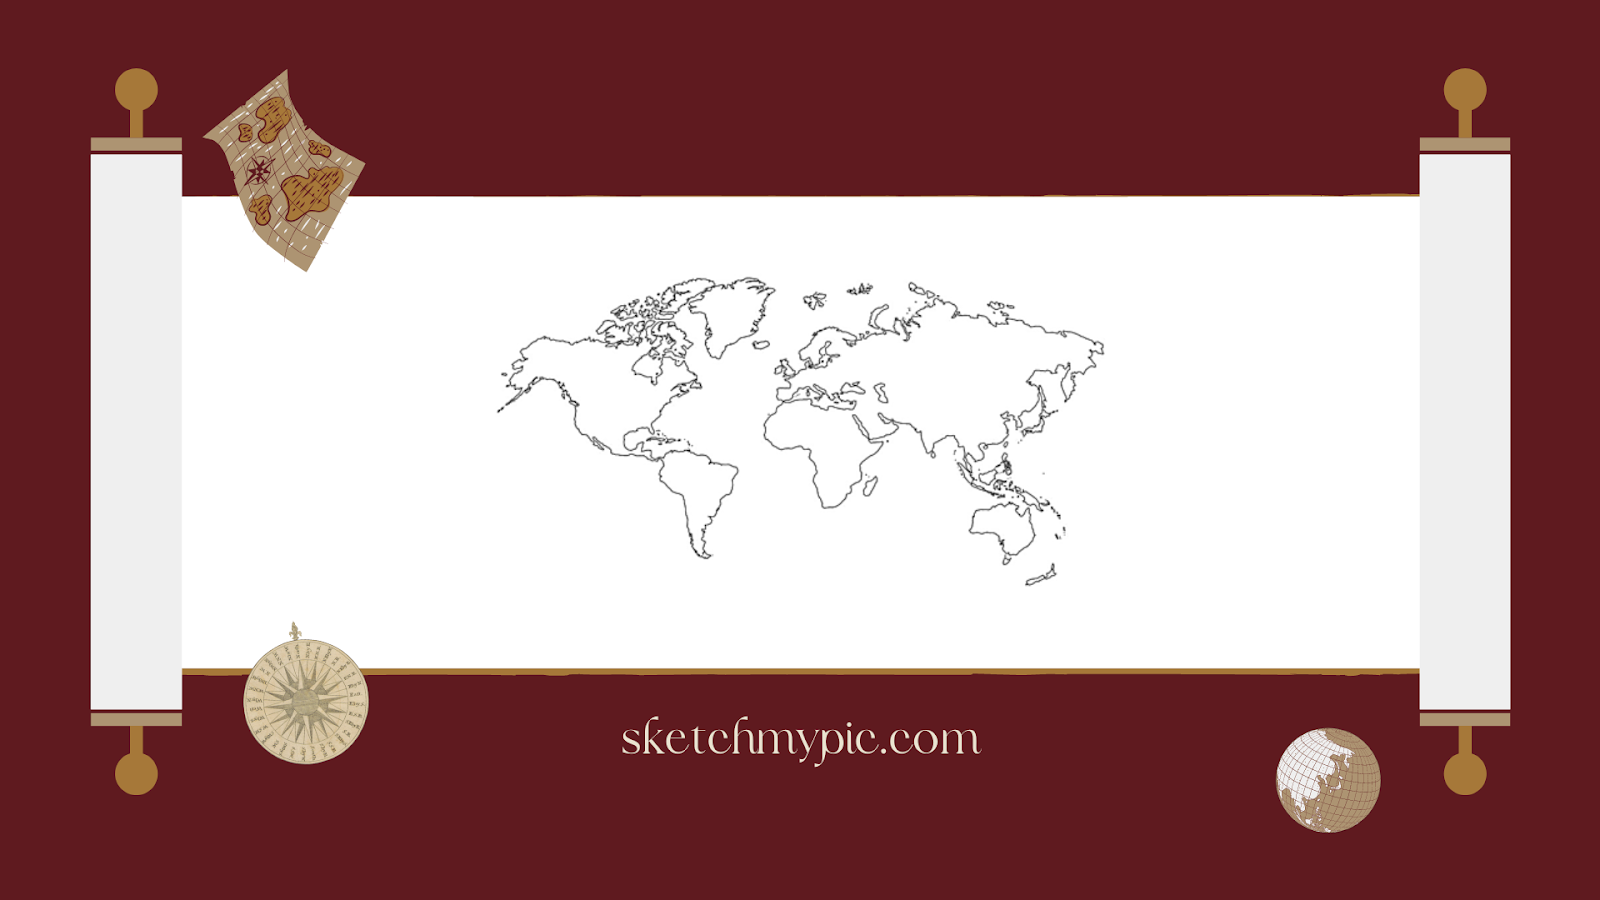
The first step is to define the boundaries of your map. Use a pencil to sketch the outline of your map, ensuring that it accurately reflects the size and shape of the area you want to represent.
Next, add landmarks and features to your map, such as mountains, rivers, and roads. Use symbols to represent different features, and ensure that they are placed accurately on the map.
Tip: Use a ruler to ensure that your lines are straight and your symbols are the correct size.
Now it's time to add labels to your map. Use clear and legible typography to label different features, such as cities, towns, and bodies of water. Be sure to include important information such as street names and building names.
Take a step back and examine your map. Look for any inaccuracies or areas that need improvement. Refine your map until it is accurate and aesthetically pleasing.
Tip: Get feedback from others to ensure that your map accurately represents the area and is easy to read.
By following these simple steps, you can create a map that effectively communicates information and is visually engaging. Happy map drawing!
Maps are not just about conveying information, but also making them visually engaging. Adding visual elements can take your map from looking plain to aesthetically pleasing. Here are some techniques to enhance your map's visual appeal:
Choosing an appropriate color scheme can help convey information and make your map more visually engaging. You can opt for a natural color scheme (greens and browns for forests and hills), a monochromatic scheme (shades of a single color), or a contrasting scheme (opposite hues on the color wheel).
Typography can also play a significant role in enhancing your map's visual appeal. Using clear and legible fonts can make your map easier to read. You can also use different font sizes and weights to create hierarchy and draw attention to specific elements.
Symbols can help make your map more informative and visually appealing. Using simple and clear symbols can help convey information without cluttering the map. It is also essential to use symbols consistently throughout the map.
Decorative elements such as frames, borders, or illustrations can provide a unique and personal touch to your map. However, it's essential to ensure that they do not overwhelm the map and distract from the primary purpose of conveying information.
By following these techniques, you can create visually appealing maps that convey information effectively.
Legends and scale bars are essential components of a map that provide crucial information to the reader. While legends explain the symbols and colors used on the map, scale bars provide an accurate visual representation of distance. Let's explore these elements in more detail.
Legends are invaluable in helping readers understand the symbols and colors used on a map. When creating a legend, it's important to be as clear and concise as possible. Use simple language and avoid cluttering the legend with unnecessary information.
Include the title of the map, a description of the symbols and colors used, and any other relevant information. Organize the legend in a logical manner, such as by feature type or color category.
Ensure that the legend is accurate and up-to-date. Double-check symbols and colors to avoid confusion or misinterpretation. If using a template, make sure to customize it to fit the specific content of your map.
Scale bars provide a visual representation of distance on a map. They are typically located in the bottom or lower-left corner of the map. When choosing a scale bar, consider the purpose and audience of the map. Select a scale bar that is appropriate for the intended use of the map.
There are different types of scale bars, including linear, divided, and graphic. Linear scale bars use a straight line to represent distance, while divided scale bars are marked with ticks and numbers indicating measurement. Graphic scale bars use a graphic representation to show distance.
Choose a scale bar that is easy to read and understand. Use clear and legible font sizes for the numbers and labels on the scale bar. Ensure that the scale bar is accurate and matches the scale of the map.
By including an informative and accurate legend and selecting the appropriate scale bar, you can enhance the usability and readability of your map. These finishing touches provide important information that helps users understand the content of the map.
Are there any free tools to create maps?
Yes, several free tools are available online to create maps. Some popular ones include Google My Maps, QGIS, and OpenStreetMap. These tools are easy to use and come with a wide range of features and customization options.
How do I create a custom map for my business?
To create a custom map for your business, start by identifying your business's location and marking it on the map. Next, add relevant landmarks, such as nearby attractions or other business locations. You can also customize the map's color scheme, typography, and symbols to match your brand's aesthetic. Finally, include a legend and scale bar for clarity.
Accuracy and precision are crucial in map drawing, especially when using the map for navigation or research purposes. To ensure accuracy, use reliable data sources and double-check measurements and scale. To achieve precision, use a steady hand when sketching and consider using a ruler or other measuring tool.
What is the difference between a physical map and a political map?
A physical map shows the physical features of a region, such as mountains, rivers, and forests. In contrast, a political map shows the administrative boundaries of a region, such as countries, states, and cities.
Yes, satellite imagery is a popular method of data collection for map creation. Online tools such as Google Earth and NASA's Worldview provide access to high-quality satellite imagery, which can be used to create detailed and accurate maps.
Where can I find more resources for map enthusiasts?
There are several online communities and resources available for map enthusiasts. Some popular ones include the Cartography Guild, Reddit's MapPorn community, and the National Geographic Society's MapMaker Interactive.
Choosing the correct map projection depends on several factors, including the map's purpose, the scale, and the region being mapped. Some widespread projections include Mercator, Robinson, and Winkel Tripel. It is essential to consider the advantages and limitations of each projection before making a decision.
What are some common mistakes to avoid when drawing a map?
One common mistake to avoid is using too many symbols or colors, which can make the map cluttered and confusing. Labelling all features clearly and accurately and ensuring the scale is consistent throughout the map is also essential. Finally, remember to consider the map's purpose and audience when choosing visual elements and data sources.